Cytoscape is a useful tool for doing network analysis. You can read more about the various operations available in Cytoscape here.
Download Cytoscape
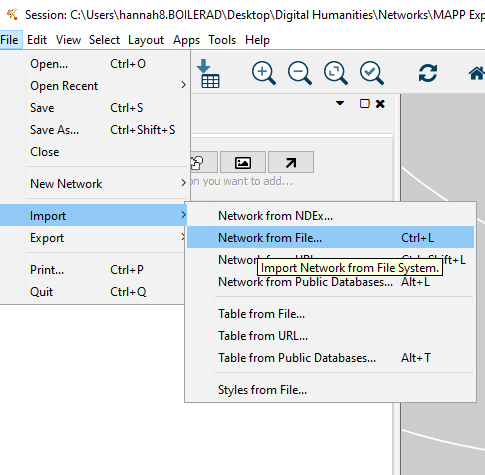
To open a file for a new network:
File > Import > Network from File > Select File
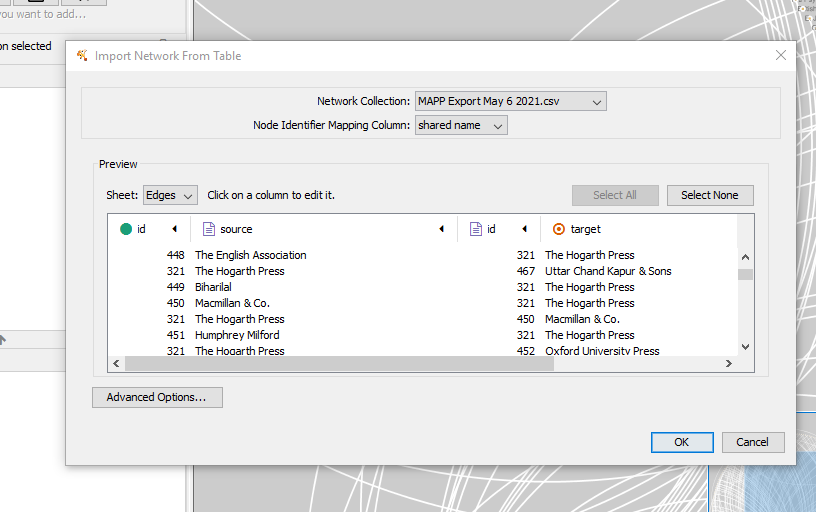
Will load a preview of data. Includes two sheets: nodes and relations. We want to ensure the green (source) and red (target) categories are correct. This will determine the “flow” of the edges.
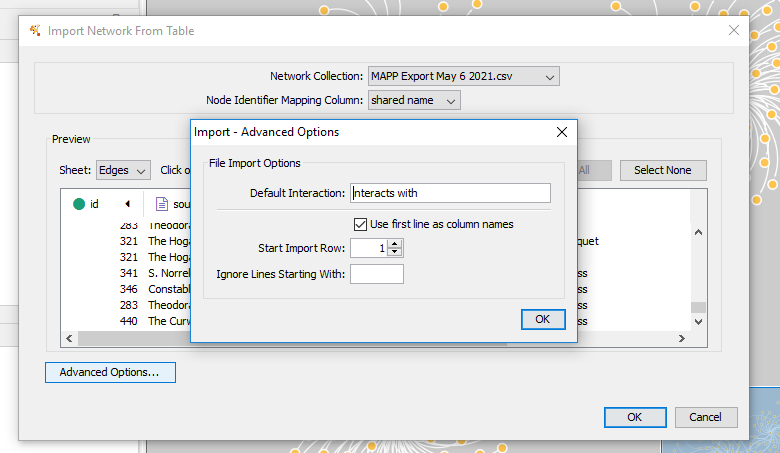
Cytoscape will take your spreadsheet and try to organize it.
Selecting “advanced” will allow you to select the default relationship. Let’s change this to “corresponded with.”
You can edit a column by selecting it and choose type of column.
Select the “name” columns to be source and target rather than the IDs.
Click “OK” when done.
Once you click OK, Cytoscape will create a default network of all your nodes connected by edges!
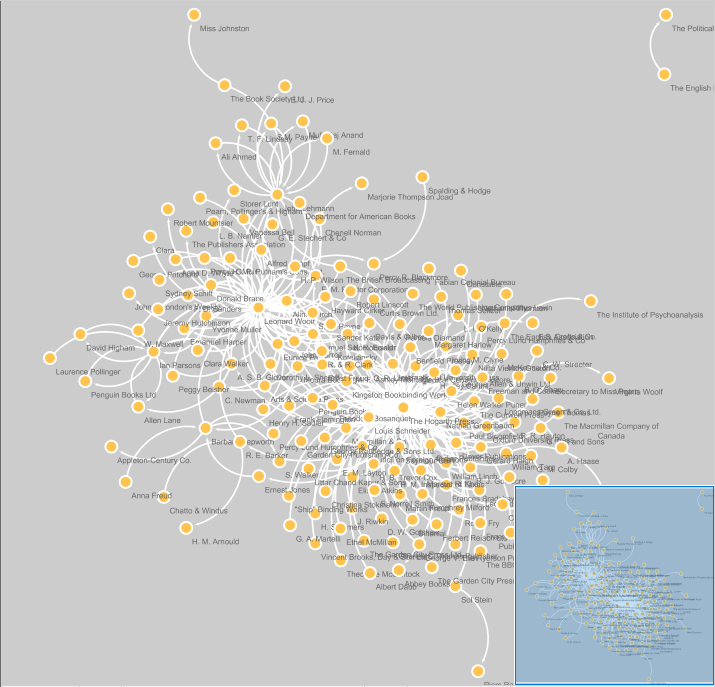
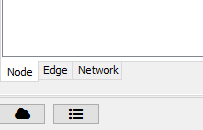
We can make changes to the network style and layout through various features in Cytoscape. You can modify nodes, edges, and the network by selecting the proper tab at the bottom of the Control Panel.
You can also select a style template from drop down at top.
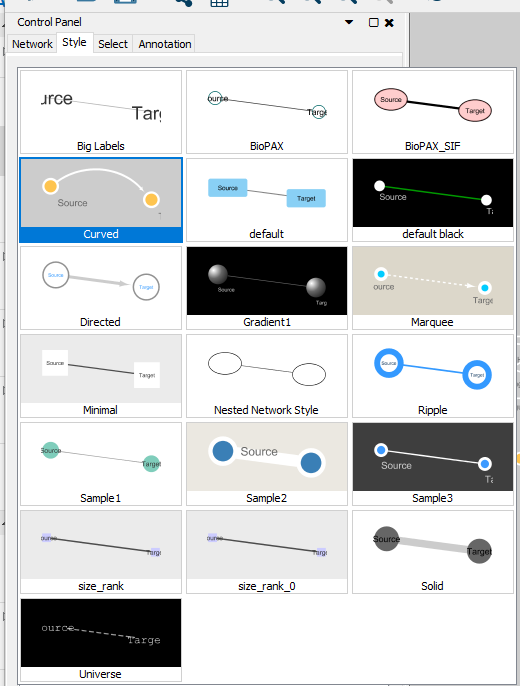
Each of the features listed under “style” can be modified. You can change labels, node colors, add images, change edge styles. Your network is highly customizable.
There are also some filtering operations available under “select” and you can choose your own filter options.
You can also add annotations or images to your project as well.
But there are also tools available to analyze the statistical aspects of your network.
Click on Tools > Network analyzer > Analyze network > Directed > Visualize Paremeters at the top.
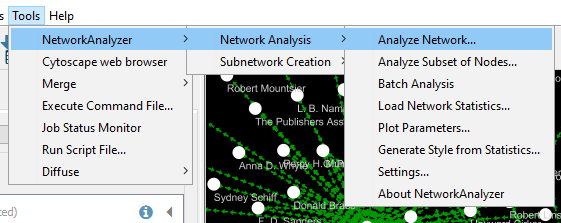
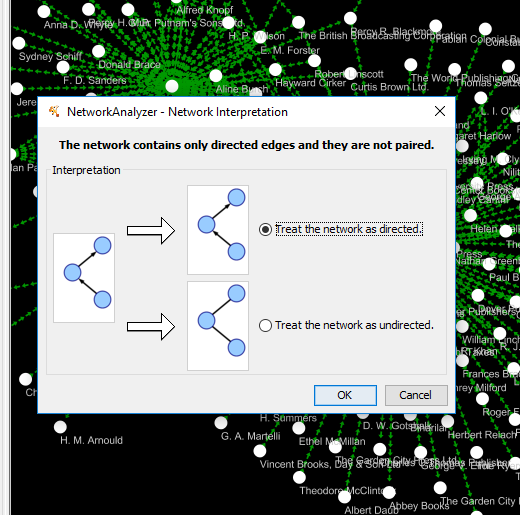
Running this analysis will open a side pane with various statistics about your network.
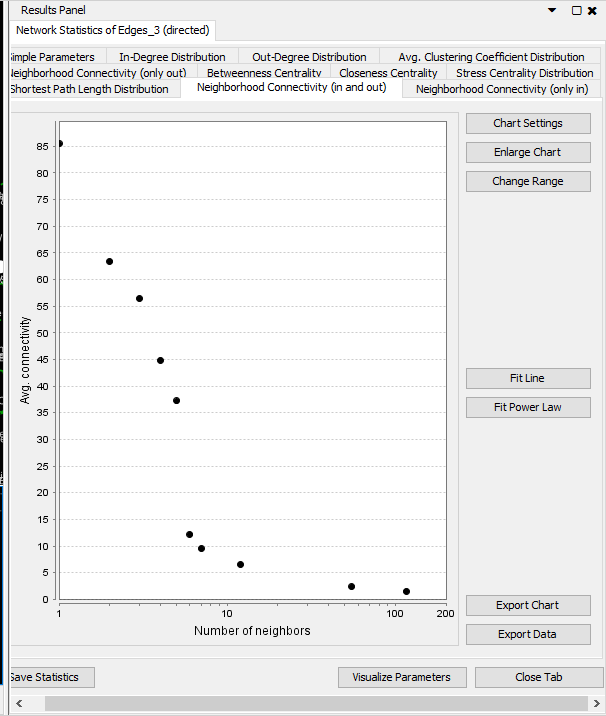
These statistics are important in network science.
-
Neighborhood Connectivity: The connectivity of a node is the number of its neighbors. The neighborhood connectivity of a node n is defined as the average connectivity of all neighbors of n. The neighborhood connectivity distribution gives the average of the neighborhood connectivities of all nodes n with k neighbors for k = 0,1
-
In-Degree Distribution / Out-Degree Distribution: In undirected networks, the node degree of a node n is the number of edges linked to n. A self-loop of a node is counted like two edges for the node degree [5]. The node degree distribution gives the number of nodes with degree k for k = 0,1,….In directed networks, the in-degree of a node n is the number of incoming edges and the out-degree is the number of outgoing edges. Similar to undirected networks, there are an in-degree distribution and an out-degree distribution.
-
Avg. Clustering Coefficient Distribution: The average clustering coefficient distribution gives the average of the clustering coefficients for all nodes n with k neighbors for k = 2,…
-
Betweeness Centrality: The betweenness centrality of a node reflects the amount of control that this node exerts over the interactions of other nodes in the network [19]. This measure favors nodes that join communities (dense subnetworks), rather than nodes that lie inside a community.
-
Closeness Centrality: The closeness centrality [11] Cc(n) of a node n is defined as the reciprocal of the average shortest path length.
-
Stress Centrality Distribution: The stress centrality of a node n is the number of shortest paths passing through n. A node has a high stress if it is traversed by a high number of shortest paths. This parameter is defined only for networks without multiple edges.
Read more detailed descriptions here
Each chart and data can be exported.
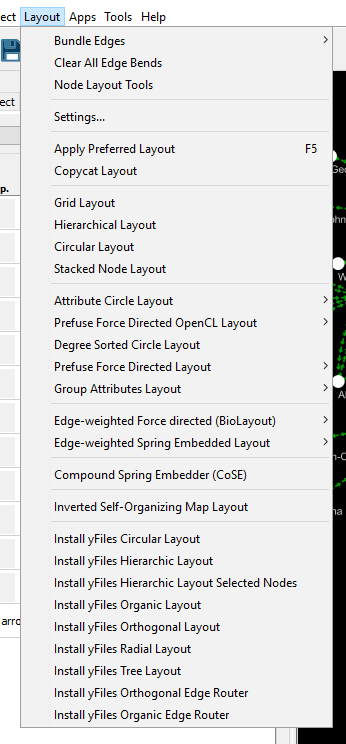
You can also change the layout by selecting the layout tab and choosing a layout. WARNING: Doing so will overwrite any other customizing you may have done.
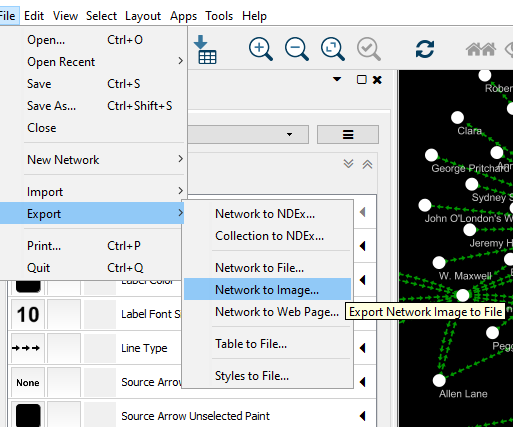
Finally, once you’re done with your network, you can export an image of your network!
